This report provides a comparative analysis of the individual country studies produced for Macedonia, Spain, Portugal and Turkey. The survey is part of the project ‘Digital Schools Contest’, under a Ka2 (Cooperation for innovation and the exchange of good practices) of Erasmus+ Programme, specifically called DISCO. The project is coordinated by the South East European University (Macedonia) with Inercia Digital (Spain), Pakize Kokulu Anadolu Lisesi (Turkey), SSOU Mosha Pijade (Macedonia) and Zendensino (Portugal).
A long term cooperation is provided in order to get the main goals of the overall project - to enhance the key competences and skills on ICT and learning performance of young people attending schools, through promoting quality improvements, innovation excellence at the level of education; to raise awareness of a European lifelong learning area designed to complement policy reforms at national level; and to support the modernization of education systems with digital integration in learning.
Introduction
This is a questionnaire oriented to European staff and teachers of every grade of Primary and Secondary (High) Education. It deals about the introduction and needs of formation about ICT within the educative institutions.
The survey consists of 86 representatives, who were mainly directors of the schools. The survey was conducted in four countries: Spain, Macedonia, Portugal and Turkey. The interviews were conducted during the period January-March 2016.
The summary statistics of the overall sample and further sub grouped by country are shown on Table 1.
| Variables | Obs. | Mean | Std. Dev. | Min | Max |
| Number of students | 86 | 655.66 | 437.96 | 17 | 1600 |
| Number of teachers | 86 | 48.88 | 28.80 | 2 | 152 |
| Number of management staff | 86 | 9.55 | 16.67 | 0 | 97 |
| Number of other staff | 86 | 11.04 | 20.07 | 0 | 150 |
Summarized statistics for Spain is shown below.
| Variables | Obs. | Mean | Std. Dev. | Min | Max |
| Number of students | 13 | 365.76 | 374.14 | 17 | 1400 |
| Number of teachers | 13 | 35.76 | 33.50 | 2 | 110 |
| Number of management staff | 13 | 4.84 | 10.67 | 0 | 40 |
| Number of other staff | 13 | 5.07 | 5.43 | 1 | 20 |
Subsequently are shown the statistics for Macedonia.
| Variables | Obs. | Mean | Std. Dev. | Min | Max |
| Number of students | 30 | 802.40 | 419.56 | 69 | 1600 |
| Number of teachers | 30 | 61.90 | 30.10 | 16 | 152 |
| Number of management staff | 30 | 5.20 | 4.32 | 1 | 25 |
| Number of other staff | 30 | 21.23 | 31.26 | 0 | 150 |
Next are shown the statistics for Portugal.
| Variables | Obs. | Mean | Std. Dev. | Min | Max |
| Number of students | 17 | 288.41 | 77.63 | 86 | 400 |
| Number of teachers | 17 | 30.76 | 9.15 | 15 | 45 |
| Number of management staff | 17 | 7.82 | 2.69 | 3 | 13 |
| Number of other staff | 17 | 8.88 | 3.78 | 3 | 17 |
And finally, outlined statistics for Turkey is shown below.
| Variables | Obs. | Mean | Std. Dev. | Min | Max |
| Number of students | 26 | 871.42 | 408.96 | 88 | 1590 |
| Number of teachers | 26 | 52.26 | 25.49 | 8 | 110 |
| Number of management staff | 26 | 18.07 | 27.43 | 1 | 97 |
| Number of other staff | 26 | 3.69 | 3.31 | 1 | 10 |
Discussion: As it can be seen from the descriptive statistics above, the highest number of students and teachers is evidenced in schools in Macedonia. Whereas the highest average management team number is evidenced in Turkey.
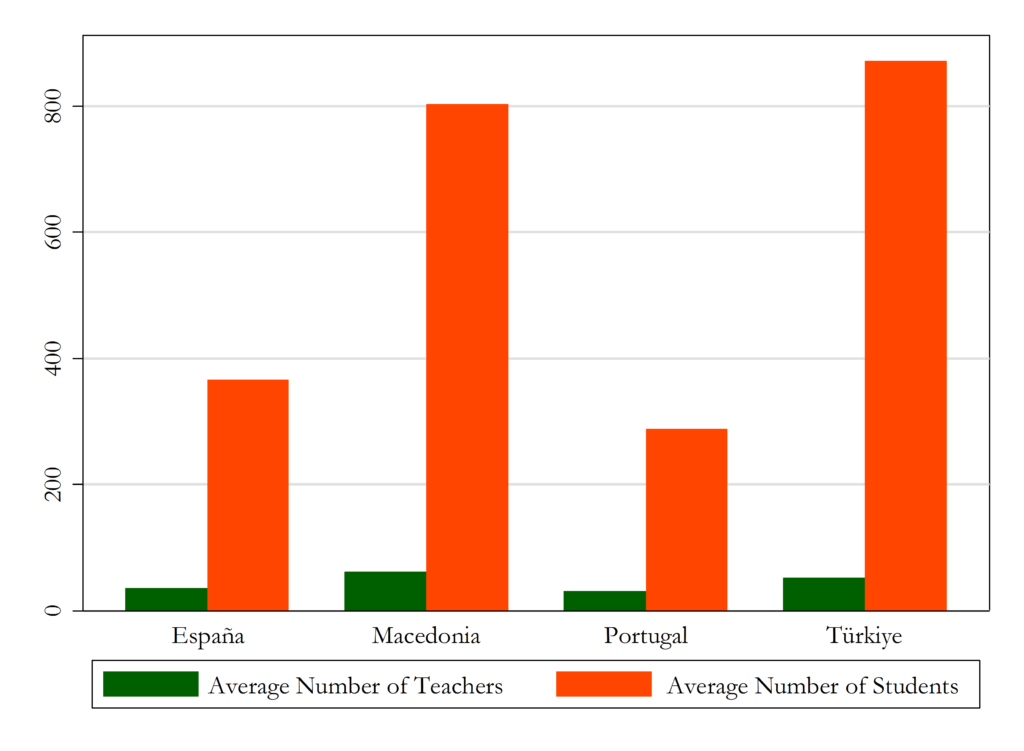
The next comparison of the survey results if for the number of students and number of teachers, grouped by country, as shown on the graph below.

Discussion: From figure 1, it can be noticed that the proportion of the number of students and number of teachers is different in these four countries. As it can be seen, in Macedonia and Turkey the average number of teachers is very low in relation to the number of students. Whereas in Portugal and Spain the average number of teachers is almost the same, while the average number of students is halved. In other words, the average teacher/student ratio for Macedonia and Turkey is 7.72% and 6.07% respectively, whereas for Spain and Portugal is 9.83% and 10.7% respectively.
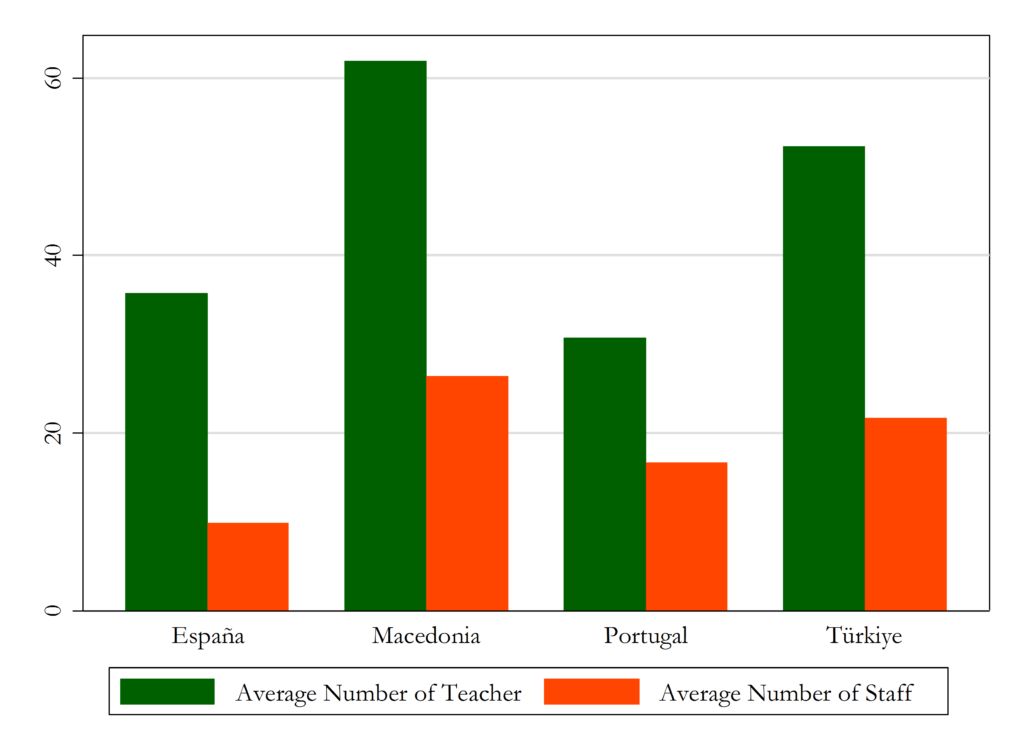
Another interesting comparison is provided with the average number of teacher and average number of staff that are engaged in these schools.

Discussion: From figure 2, it can be noticed that the proportion of the average number of staff and number of teachers is more or less the same in these four countries. As it can be seen, approximately half number of staff supports administratively the number of teachers.
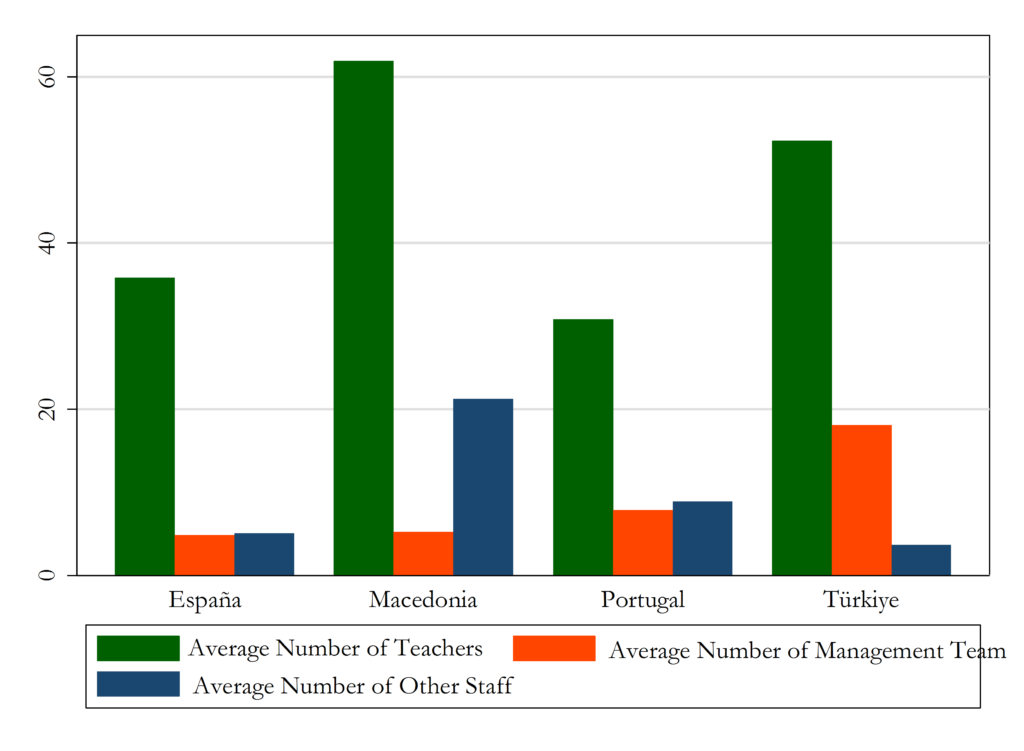
Next, the overall average number of teacher, management staff and other administrative staff is provided in the graph below.


You must be logged in to post a comment.